
ROI and the forecast calculator
Break-even & ROI answers “is this unit worth it?” - your capital in, against what the unit returns. It has two tabs, because it carries two different kinds of number: Actuals is what the portfolio has returned, measured from the books; Forecast calculator is what a configuration would return, modelled from your inputs. Keeping them apart stops a modelled figure being read as a measured one.
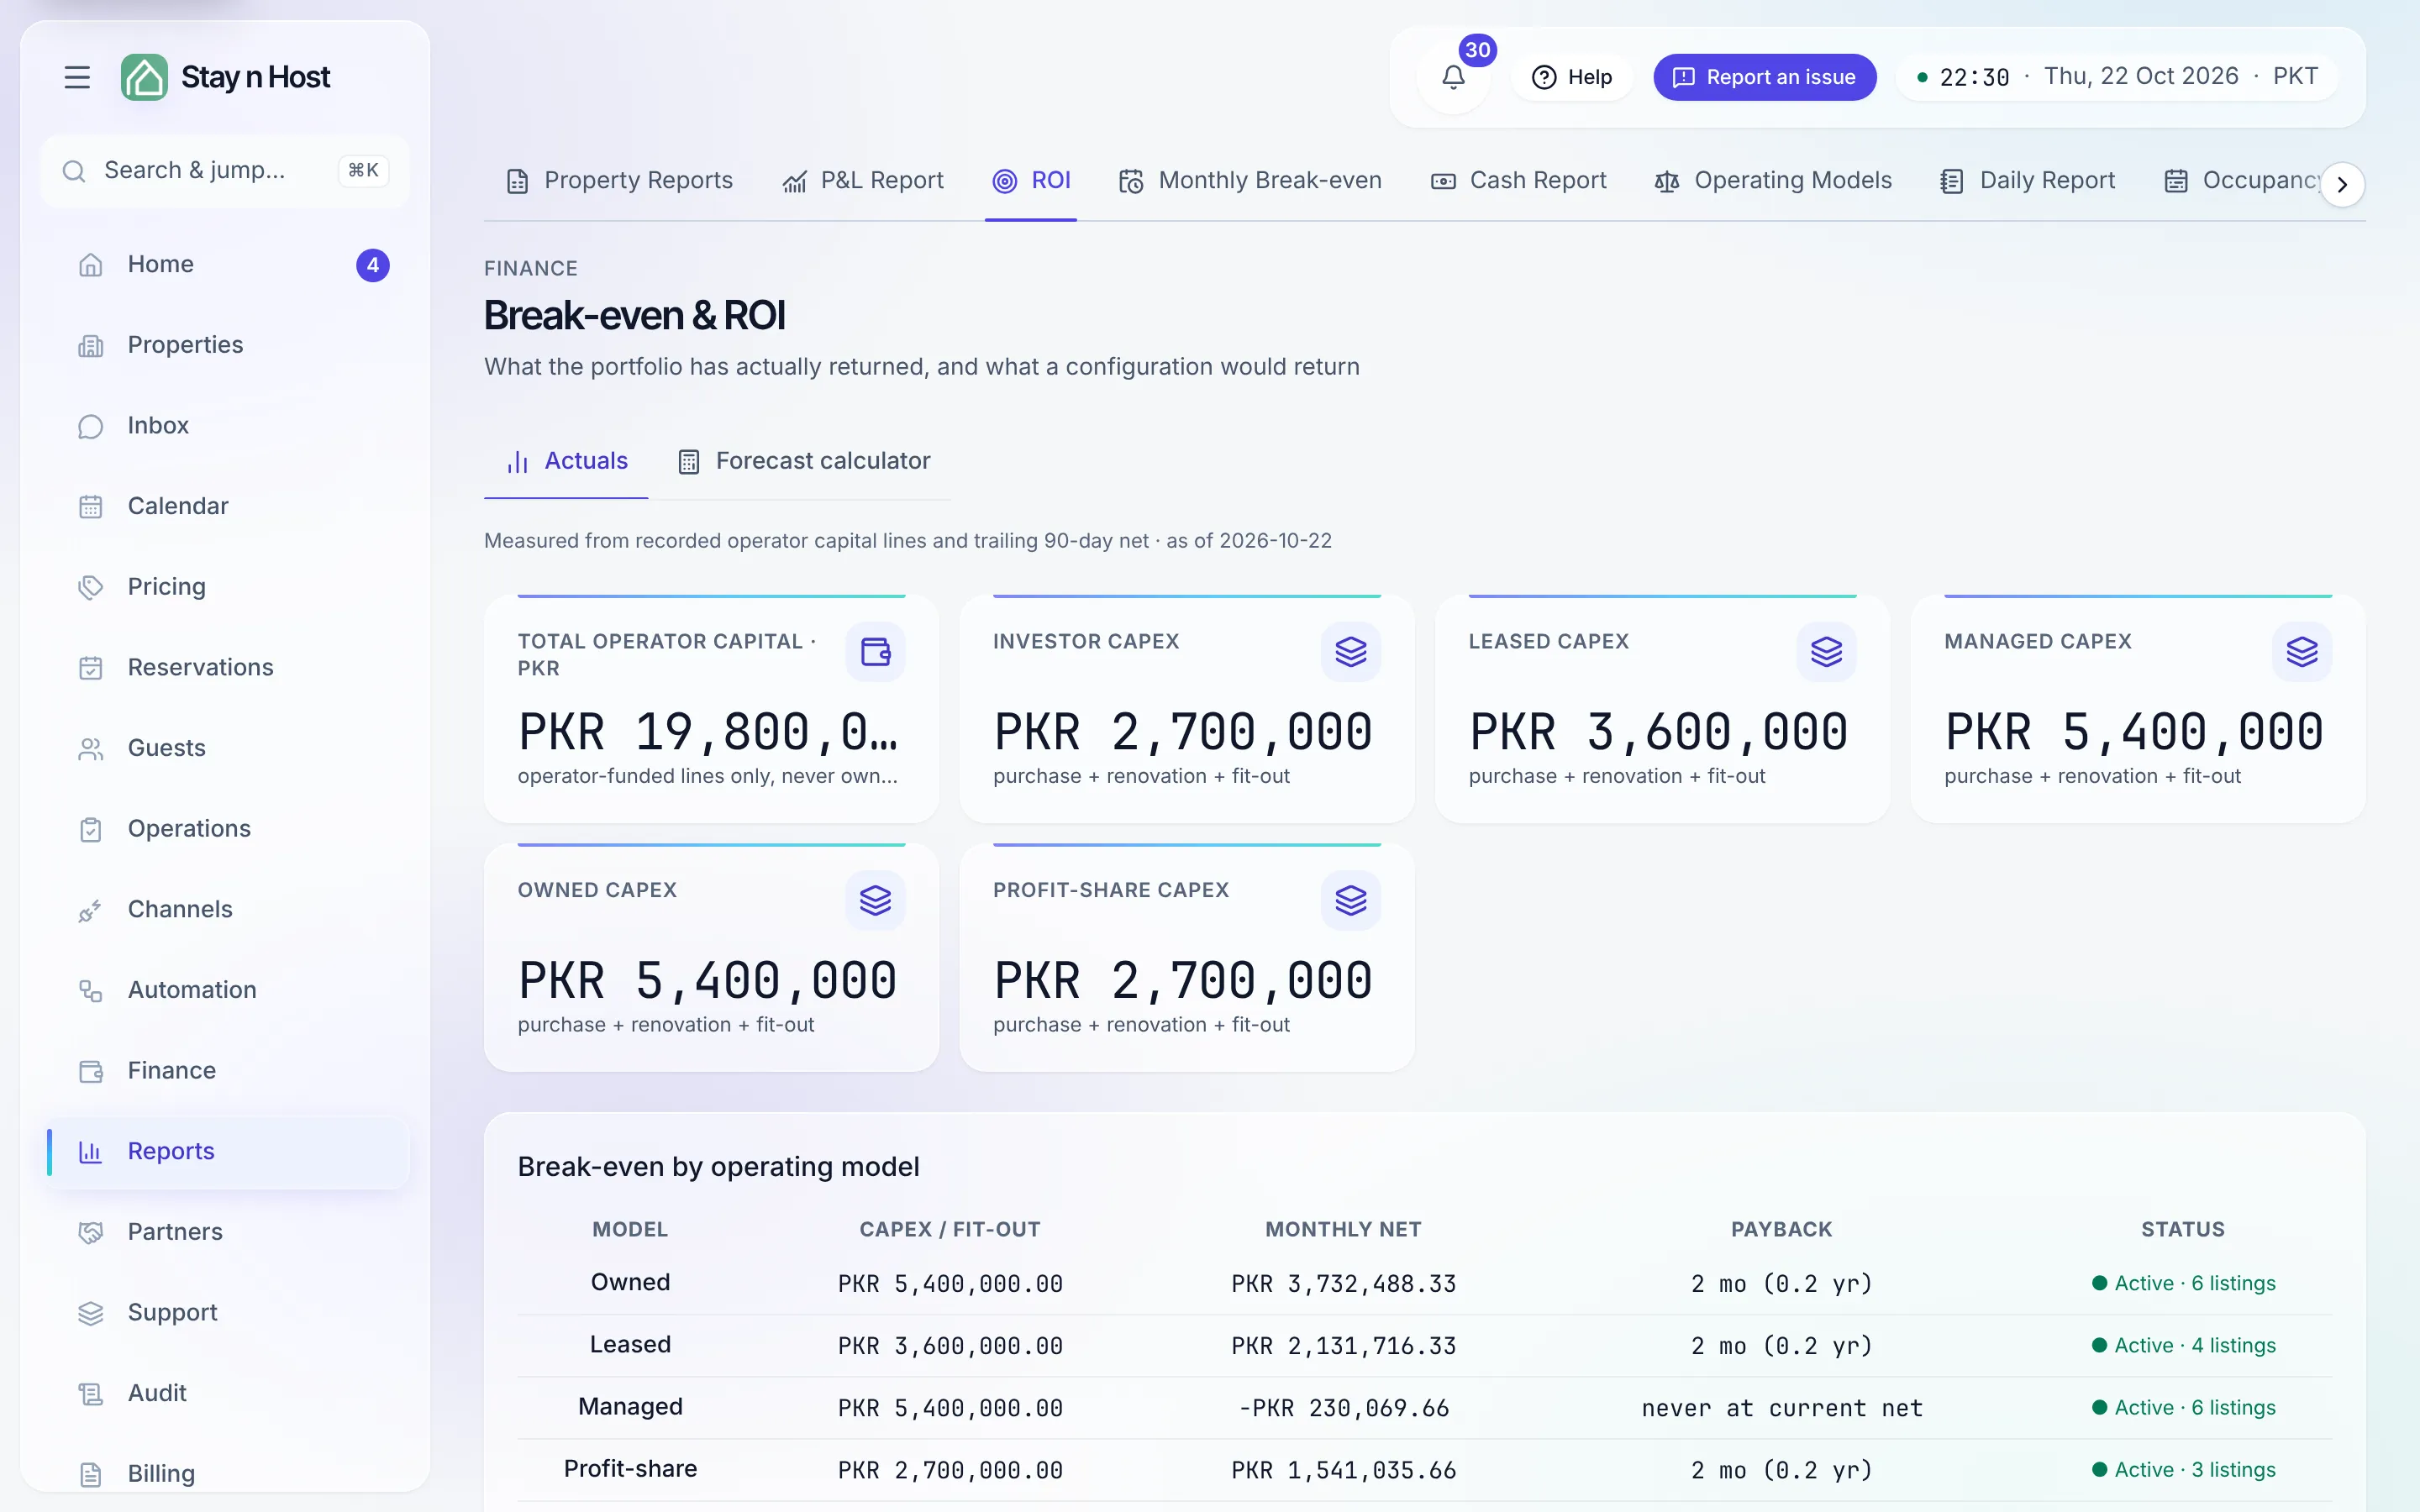
The Actuals tab
Section titled “The Actuals tab”Everything here is measured from recorded operator capital lines and the trailing 90-day net - and break-even is always the operator’s own capital at risk: owner and investor money never appears in these figures.
- Capex tiles - total operator capital, split per operating model (purchase, renovation, fit-out).
- Break-even by operating model - capex, monthly net, and payback per model; a model you don’t run yet shows as roadmap rather than being hidden.
- The per-property table - Model, Operator capex, Net / month (90d avg), Payback, Cap rate (annual net as a percentage of capital), BE occupancy and BE ADR (the occupancy or nightly rate below which the property loses money), expandable to units.
A payback of “ - “ on a property with capital means its current net is zero or negative - at today’s numbers it never pays back. That row sorts last on purpose.
Capital lines are recorded on each property’s Finance tab - until one is recorded, the table has nothing to measure.
The Forecast calculator tab
Section titled “The Forecast calculator tab”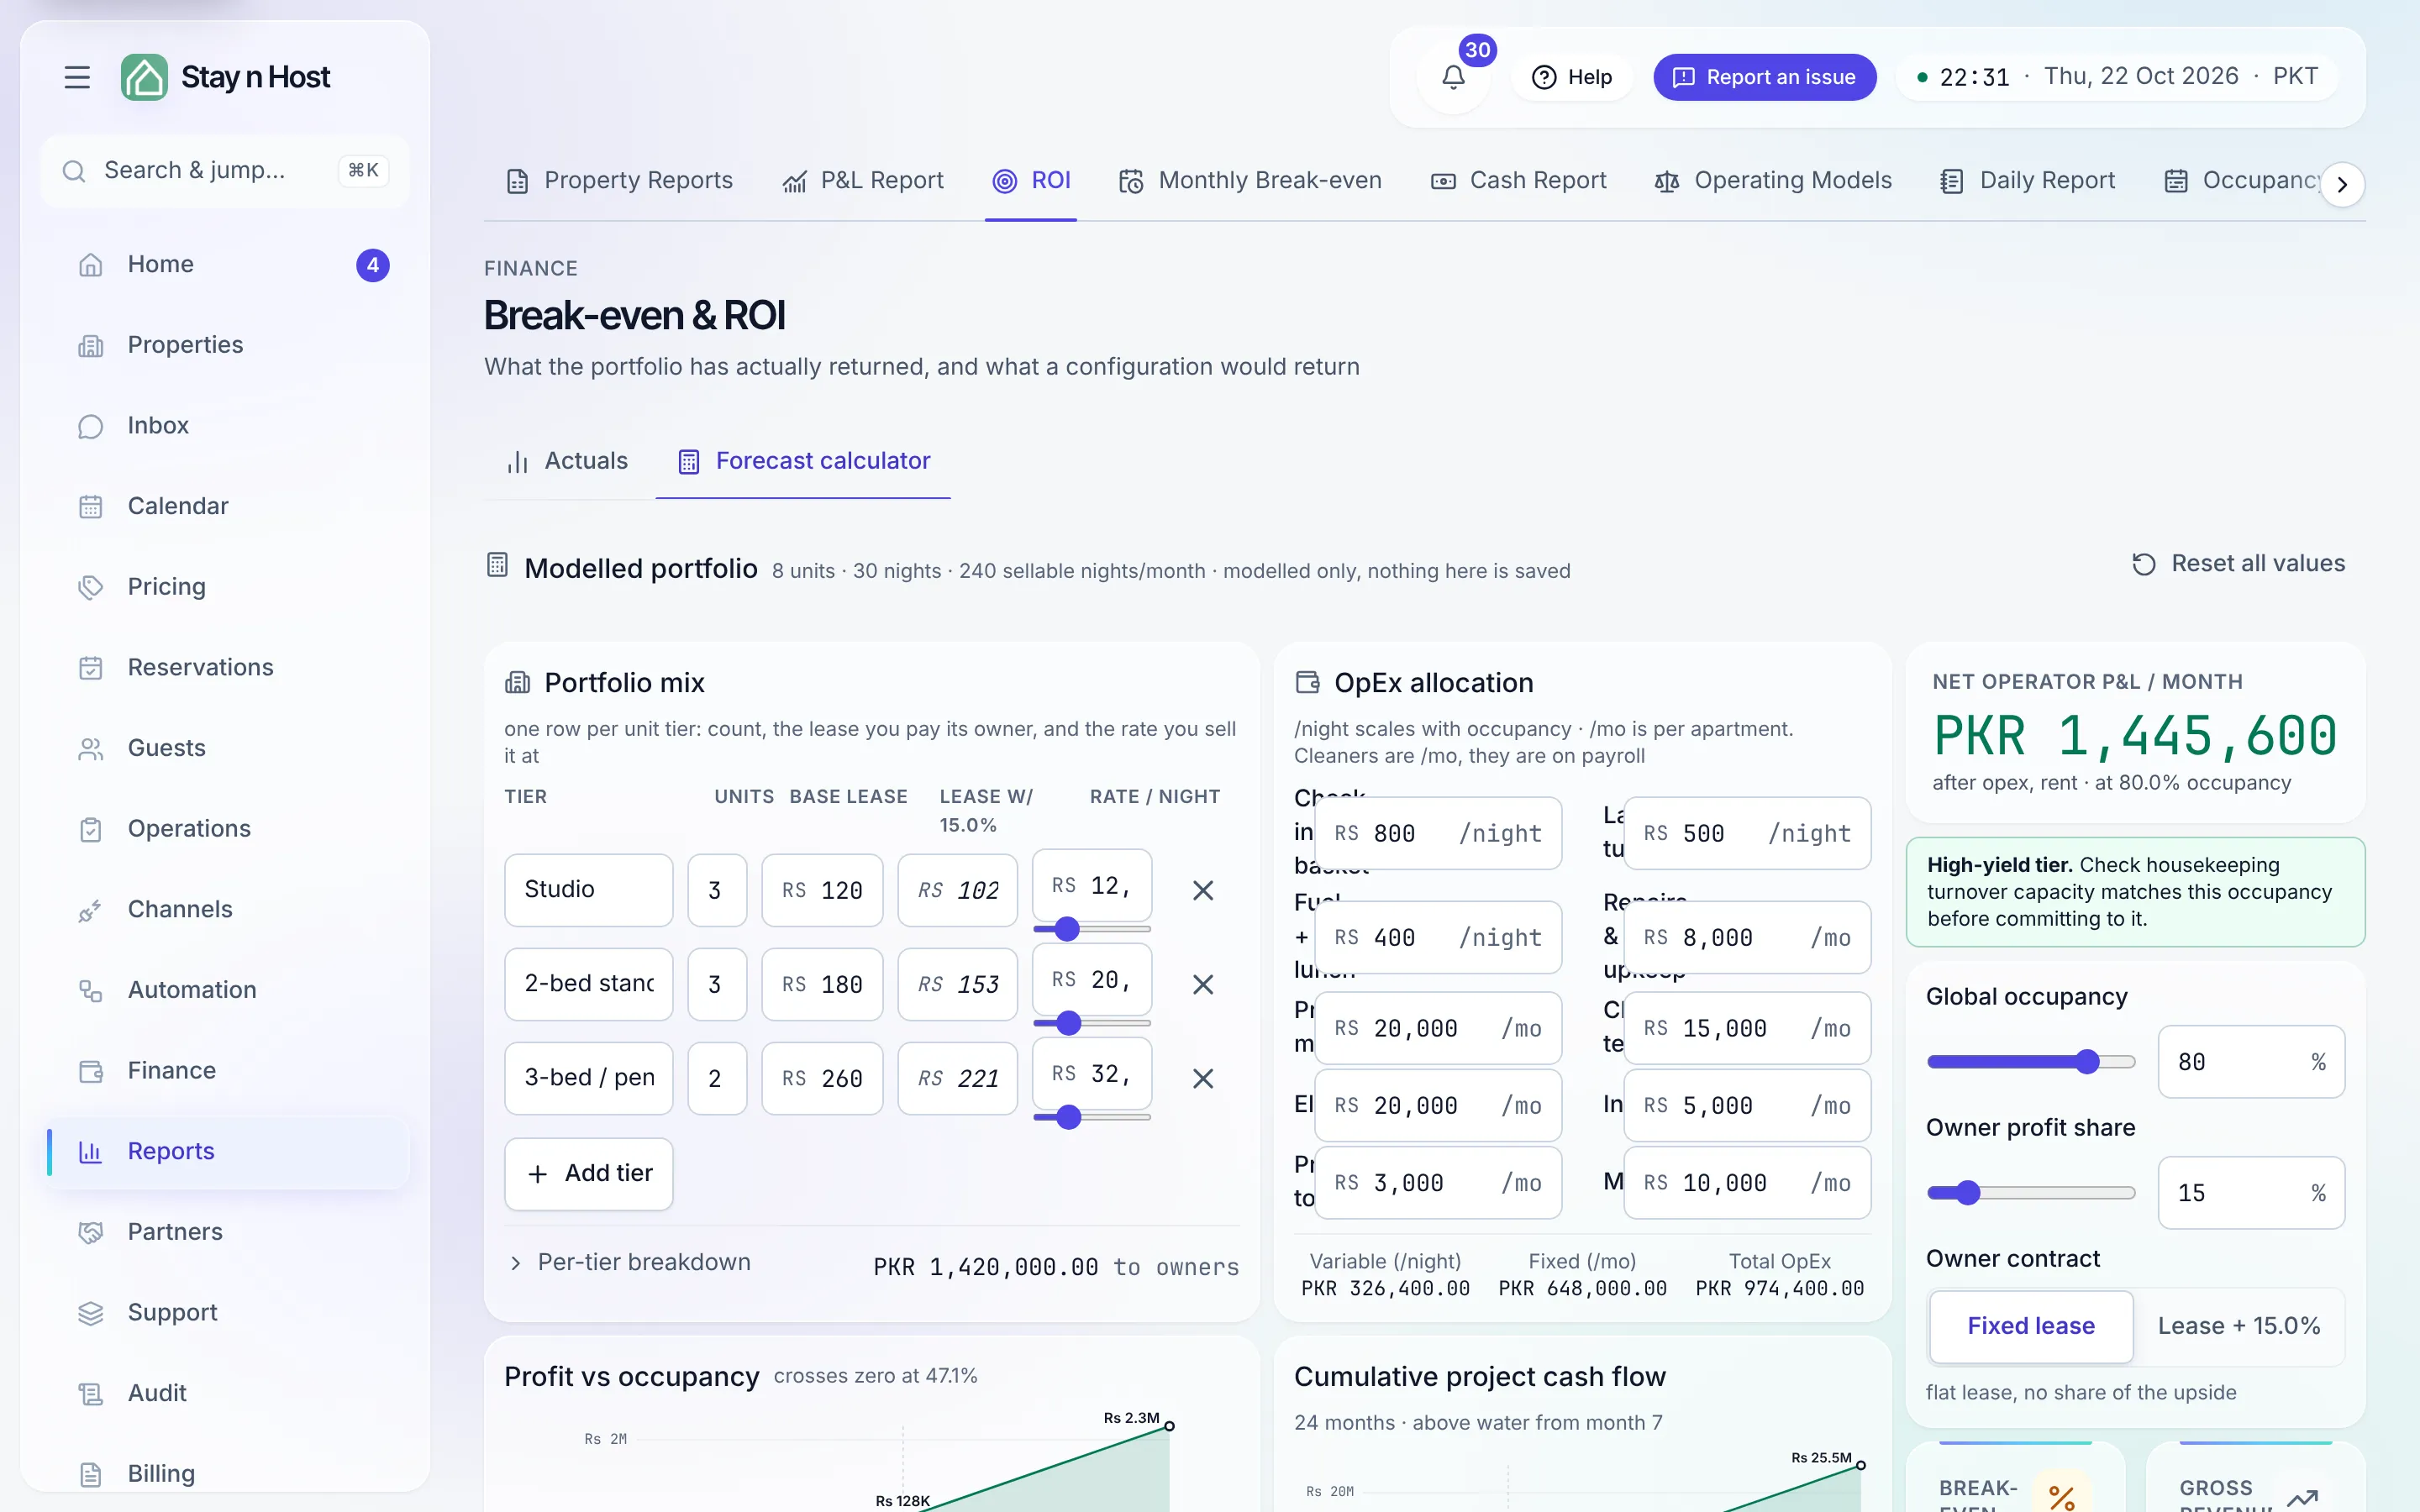
A simulator: it reads nothing from your books and stores nothing. Build a Portfolio mix of unit tiers (units, base lease, nightly rate), itemize OpEx allocation by how each cost scales (per occupied night vs. fixed per month), then sweep the three dials: Global occupancy, Owner profit share, and the Owner contract switch - Fixed lease vs. Lease + share (a reduced lease plus a share of each unit’s net).
Out come Break-even occupancy (or “Unachievable” when no occupancy covers the cost base), gross revenue, rent liability, blended ADR, a Monthly financial breakdown down to net operator P&L, profit-vs-occupancy and cumulative cash-flow charts, and an Investor returns panel: initial capital, investor profit share, monthly and annual return, capital payback, and project cap rate.
What’s next
Section titled “What’s next”- The other break-even: Monthly break-even.
- Where each unit’s model is set: Operating models register.
- Turn a forecast into a raise: Model an investor pool.