
Occupancy, ADR, and RevPAR
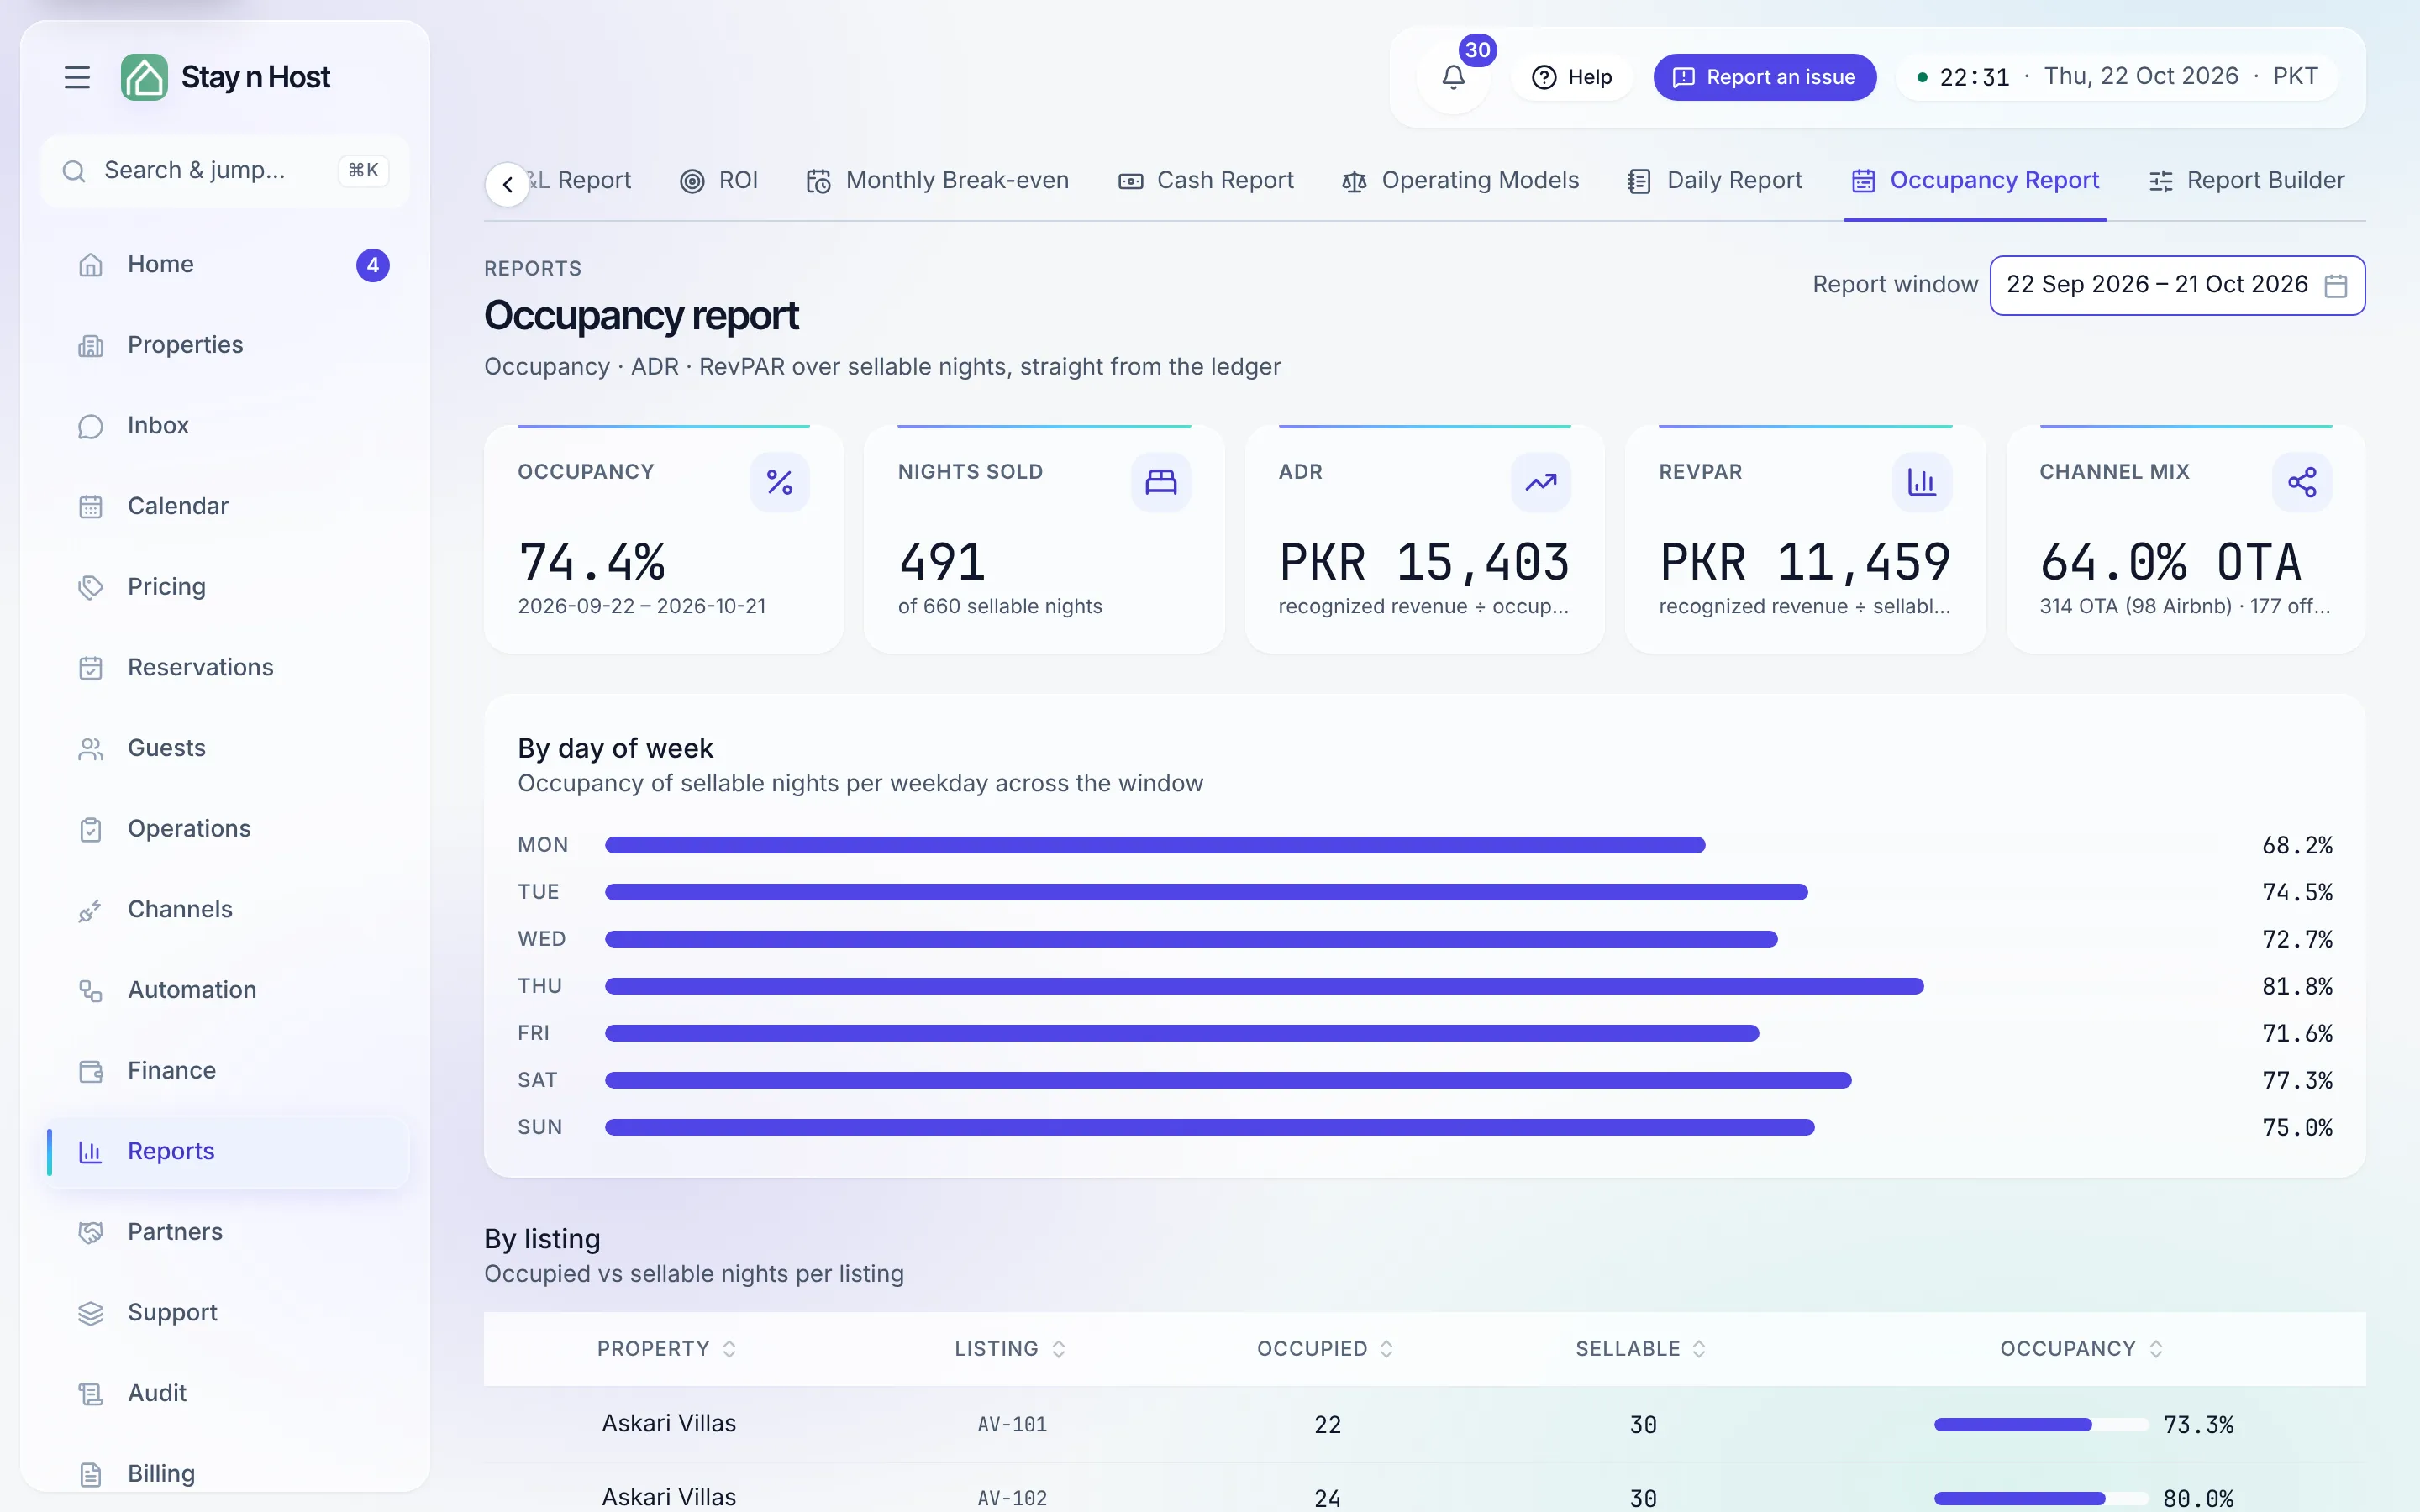
The Occupancy report (Reports -> Occupancy Report) answers “how full were we, and at what rate?” over a window you pick - default the last 30 nights, up to 400. Three metrics, defined simply:
- Occupancy - nights sold ÷ sellable nights. “Sellable” is honest: it’s your active units × the days in the window, minus nights you blocked for a full day. A unit down for renovation doesn’t count against you.
- ADR (average daily rate) - recognized revenue ÷ occupied nights: what an occupied night actually earned, on average.
- RevPAR (revenue per available room) - recognized revenue ÷ sellable nights: what every night you could have sold earned, occupied or not. RevPAR is the one that punishes empty nights - high ADR with low occupancy still shows up as weak RevPAR.
Reading the page
Section titled “Reading the page”The KPI band shows Occupancy, Nights sold (of the sellable total), ADR, RevPAR, and Channel mix (the Airbnb vs. offline share of sold nights). Below it:
- By day of week - occupancy per weekday across the window. This is where a soft Tuesday or a saturated Saturday becomes visible, and where midweek pricing decisions start.
- By listing - occupied vs. sellable nights per unit, with an occupancy bar. Sort out the chronically empty unit before averaging it away.
Pick the window with Report window; everything recomputes from the ledger’s night-level records.
What’s next
Section titled “What’s next”- The money behind the nights: Read your P&L.
- Rate floors per unit: the BE occupancy and BE ADR columns on Break-even & ROI.
- A citable version of these figures: Build your track record.